
Cross Market Comparisons
Smallest Four Selected Construction Markets Share in June 2026
A Census-based examination of the combined footprint of the four smallest categories in a defined 12-market comparison.
By HireConstructionEstimator Editorial Team | Published August 18, 2026
1 primary + 14 reader context sources | Verified August 18, 2026
Smallest Four Selected Construction Markets Share in June 2026
Key stats
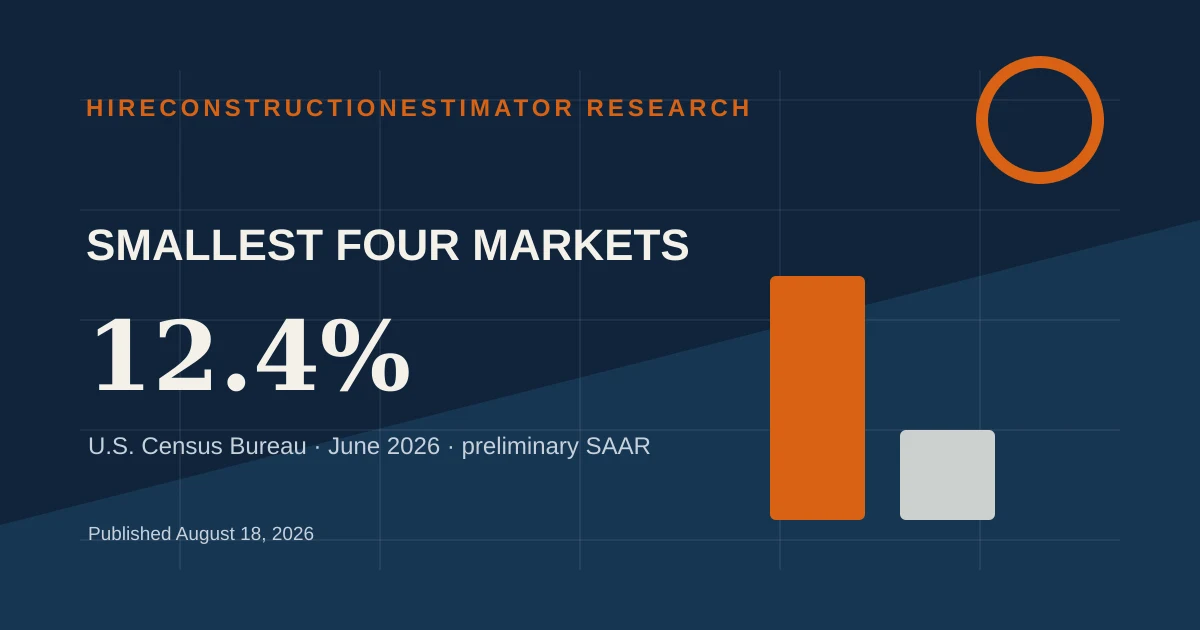
Public safety, lodging, water supply, and amusement and recreation totaled $130.5 billion, about 12.4 percent of selected-market activity in June 2026.
Contents
Key takeaways
- The four categories were the smallest by displayed annual-rate value within the selected seven-building and five-infrastructure roster.
- Their combined value was larger than commercial construction alone but smaller than office or educational construction alone.
- Small national category size cannot determine niche demand, project fit, or estimating effort in a specific region.
Identify the lower end without dismissing it
The four smallest displayed values in the selected roster were public safety at $21.2 billion, lodging at $24.5 billion, water supply at $35.7 billion, and amusement and recreation at $49.1 billion. Together they reached $130.5 billion.
The 12.4 percent share uses the full $1.0521 trillion selected-market sum. It must not be described as the smallest four categories across every line in the Census program.
National rank and local fit can diverge
A contractor near a tourism corridor, water program, or public-safety capital plan may see these sectors dominate qualified invitations. National ordering does not capture licenses, owner access, geographic specialization, or procurement calendars.
Record why a local portfolio differs from the benchmark. A deliberate specialty is not a defect, and a high national rank is not a reason to chase work outside the team’s qualifications.
Measure effort on its own axis
Smaller activity value does not imply a light estimate. Security criteria, treatment processes, operating constraints, brand standards, or specialty systems can create dense review work in these categories.
For staffing, pair opportunity value with sheet count, specification breadth, required reviewers, quote packages, and turnaround. The public share is context for that assessment, not the answer.
Key data table
Use this table as a review aid. The headline statistic is sourced directly; the interpretation rows explain how to apply it without treating a market benchmark as a project quote.
| Data point | What it says | Estimator control |
|---|---|---|
| Primary statistic | Public safety, lodging, water supply, and amusement and recreation totaled $130.5 billion, about 12.4 percent of selected-market activity in June 2026. | Source 1. Validate the project basis. |
| Interpretation 1 | The four categories were the smallest by displayed annual-rate value within the selected seven-building and five-infrastructure roster. | Source 1. Validate the project basis. |
| Interpretation 2 | Their combined value was larger than commercial construction alone but smaller than office or educational construction alone. | Source 1. Validate the project basis. |
What the data can and cannot do
Public labor, spending, productivity, and price series provide a common baseline. They can reveal direction, scale, and unusual movement. They cannot identify the exact labor crew, subcontractor coverage, waste factor, access constraint, or escalation risk on a specific project.
A responsible estimate keeps the public benchmark separate from local bid history. Record the source date, geography, units, seasonal treatment, and any conversion before using the number in an estimate review.
How estimators should use it
- Keep smaller sectors visible in a pursuit register instead of screening them out from the national rank alone.
- Compare bid count, expected review hours, and specialty requirements separately from annualized market value.
Add a source note beside every adjusted rate. If the benchmark and recent quotes disagree, do not average them automatically. Investigate geography, scope, timing, units, and market segment first.
Data sources and methodology
The primary statistic is transcribed from the source identified in the source notes below. The additional links are a consistent reader reference set for broader labor, construction volume, productivity, and regional context. They do not support or alter the headline figure and are not presented as article-specific evidence.
- The U.S. Census Bureau published the June 2026 Construction Spending release on August 3, 2026. June values are preliminary.
- Calculations use the displayed Table 1 values in seasonally adjusted annual-rate units. Component sums and percentages may vary slightly because the published values are rounded.
- Every grouping is defined in the article. Editorial groups are not official Census series and do not represent project counts, prices, backlog, or forecasts.
Conservative convention: retain the published unit and date, avoid false precision, and treat national or sector data as a planning signal until local project evidence confirms it.
Frequently asked questions
Can this statistic set a project unit rate?
No. It can challenge or frame an assumption, but a project rate still needs current scope, geography, crew, productivity, supplier, and subcontractor evidence.
How often should the source be checked?
Check the primary release before a major estimate update and record the release or access date in the estimate notes.
Why are reader context sources included?
They give readers a consistent path to broader official construction and labor series. They are not evidence for the headline statistic and do not replace or alter its primary source.
Conclusion
Public safety, lodging, water supply, and amusement and recreation totaled $130.5 billion, about 12.4 percent of selected-market activity in June 2026. Use the figure as a documented benchmark, preserve the source date and units, and require project-specific evidence before changing a bid assumption. Review our construction estimating process for the control sequence. If you need production capacity around that review process, see our construction estimator VA service.