HireConstructionEstimator

Construction Estimating Research, Page 2

Sourced market signals with key findings, data tables, methodology, and direct links to public data.

Research Articles 13 to 24

Showing 12 of 279 matching articles. Every article includes at least 10 source links and an explicit methodology note.
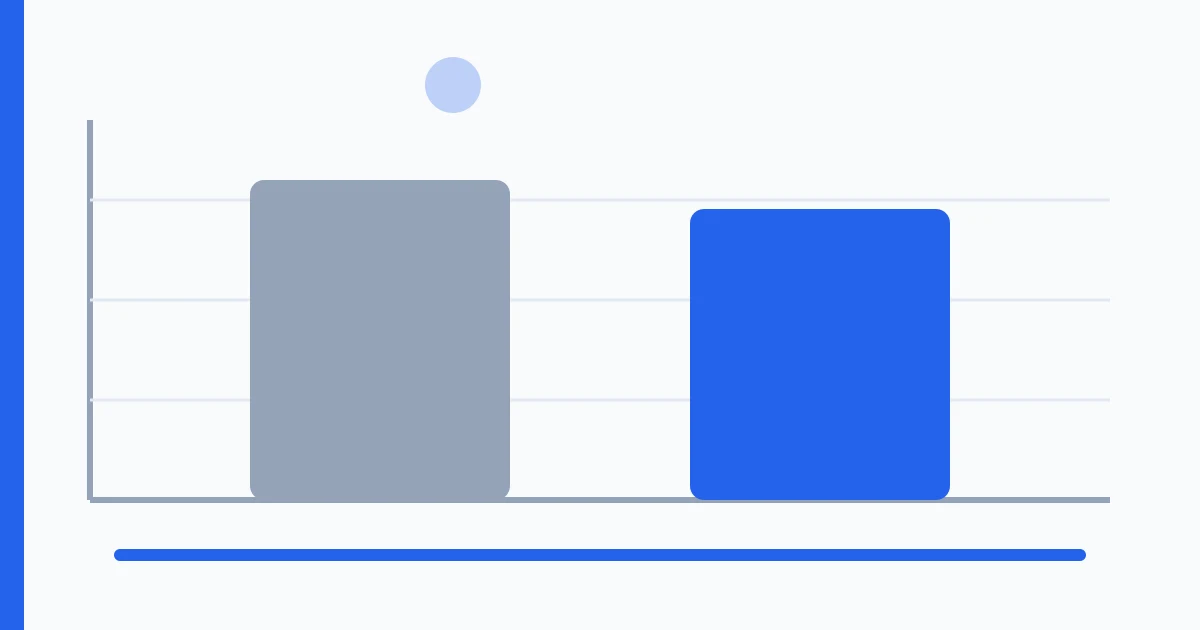
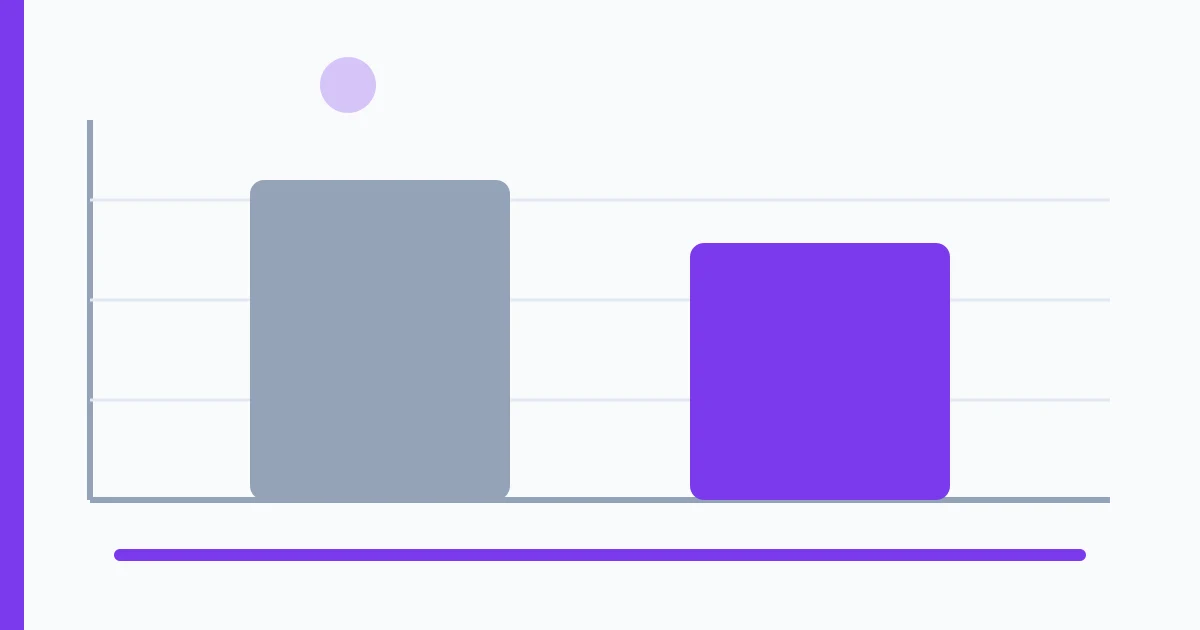
Housing Completions Fell 9.1% in July 2026 data graphic

Residential Production | 3 primary + 9 context references

Housing Completions Fell 9.1% in July 2026

Privately owned housing completions were reported at a seasonally adjusted annual rate of 1,212,000 in July, 9.1 percent below revised June.

Verified August 31, 2026

New-Home Sales Fell as Inventory Rose in July 2026 data graphic

Residential Production | 3 primary + 10 context references

New-Home Sales Fell as Inventory Rose in July 2026

New single-family home sales ran at 607,000 in July while for-sale inventory reached 488,000 and 9.6 months of supply.

Verified August 31, 2026

The New-Home Average Price Exceeded the Median by $115,000 in July 2026 data graphic

Residential Production | 3 primary + 10 context references

The New-Home Average Price Exceeded the Median by $115,000 in July 2026

The July median new-home sales price was $393,800 and the average was $508,800, a difference of $115,000.

Verified August 31, 2026

Final-Demand Construction Prices Rose 2.2% in July 2026 data graphic

Pricing and Materials | 3 primary + 10 context references

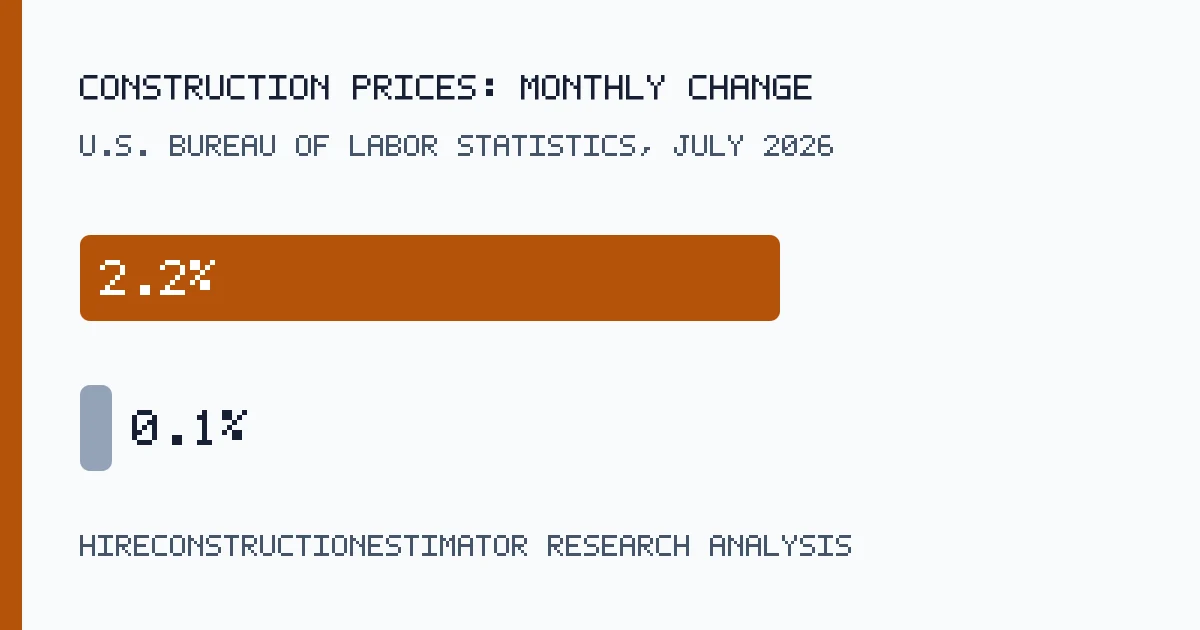
Final-Demand Construction Prices Rose 2.2% in July 2026

The final-demand construction index rose 2.2 percent in July after increasing 0.1 percent in June.

Verified August 28, 2026

Construction Producer Prices Were 5.2% Higher Than a Year Earlier in July 2026 data graphic

Pricing and Materials | 3 primary + 10 context references

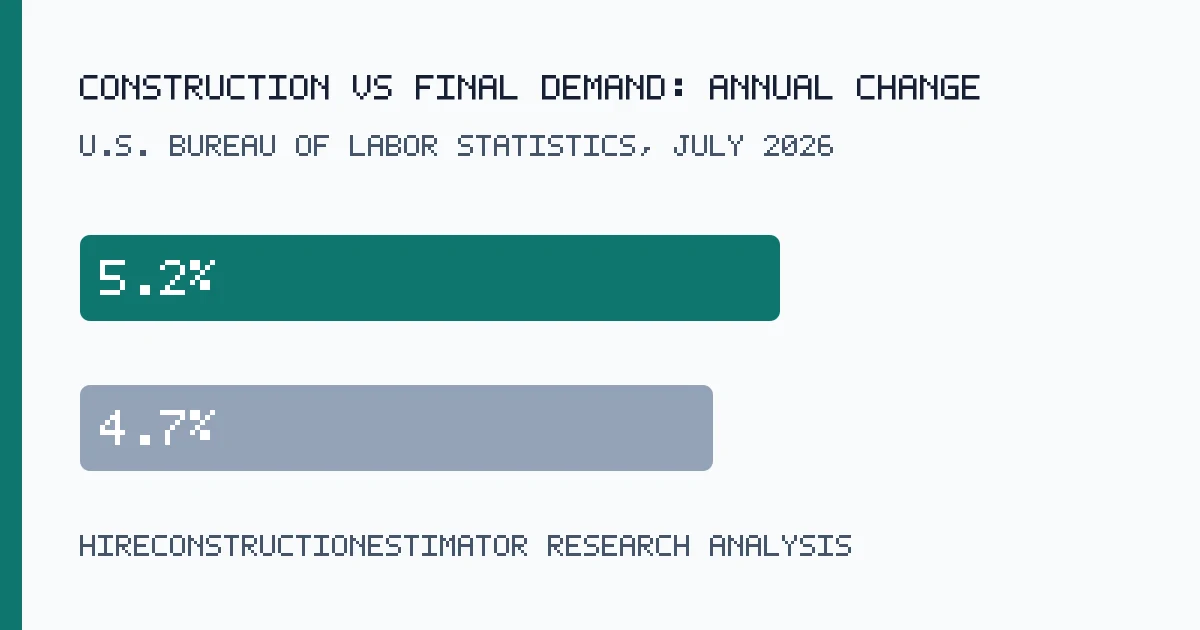
Construction Producer Prices Were 5.2% Higher Than a Year Earlier in July 2026

Final-demand construction prices were 5.2 percent above July 2025.

Verified August 28, 2026

Private and Government Construction Prices Moved Closely in July 2026 data graphic

Pricing and Materials | 3 primary + 10 context references

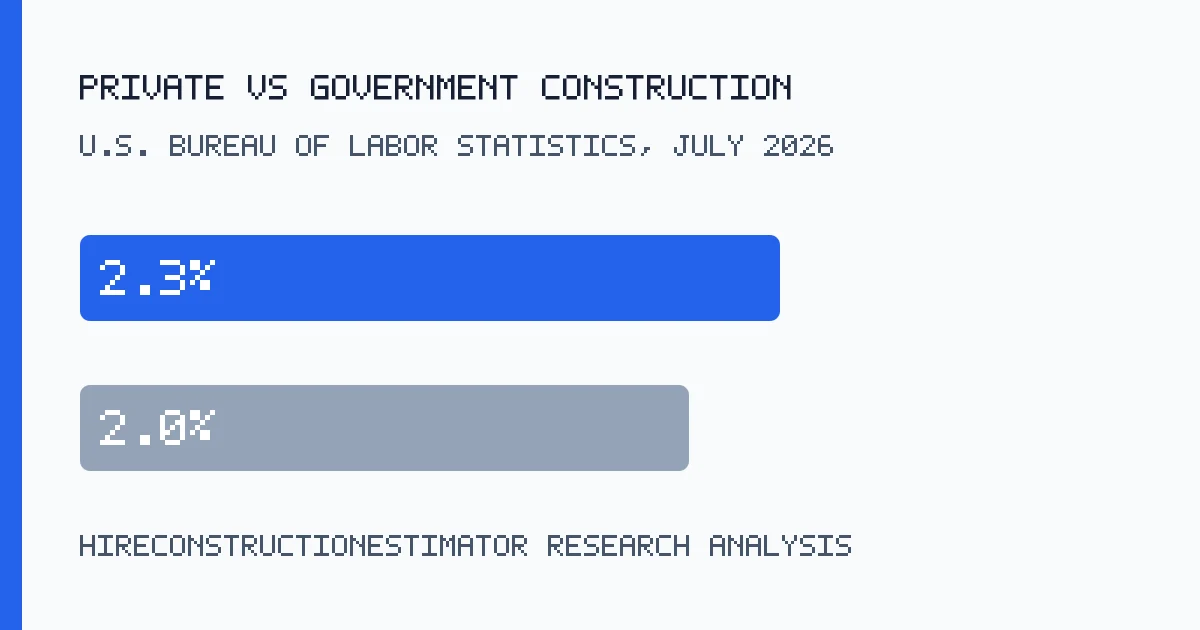
Private and Government Construction Prices Moved Closely in July 2026

Private-capital construction rose 2.3 percent in July and government construction rose 2.0 percent.

Verified August 28, 2026

Construction Prices Diverged From Goods and Services in July 2026 data graphic

Pricing and Materials | 3 primary + 10 context references

Construction Prices Diverged From Goods and Services in July 2026

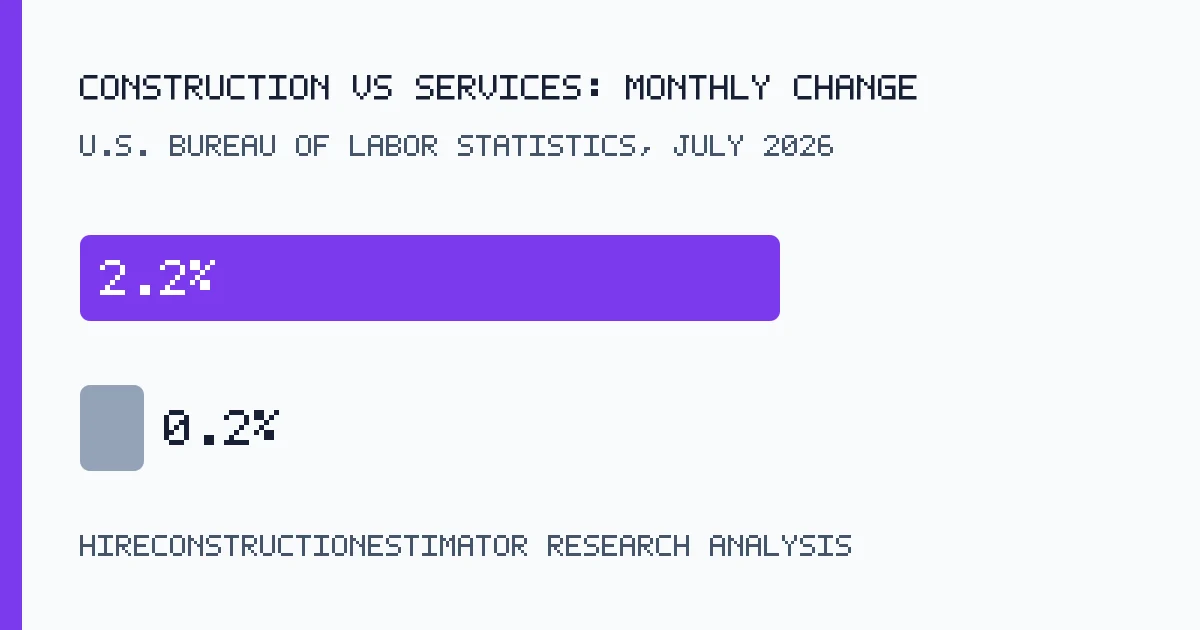
Construction rose 2.2 percent while final-demand goods fell 0.7 percent and services rose 0.2 percent.

Verified August 28, 2026

Construction Materials and Components Rose 0.5% in July 2026 data graphic

Pricing and Materials | 3 primary + 10 context references

Construction Materials and Components Rose 0.5% in July 2026

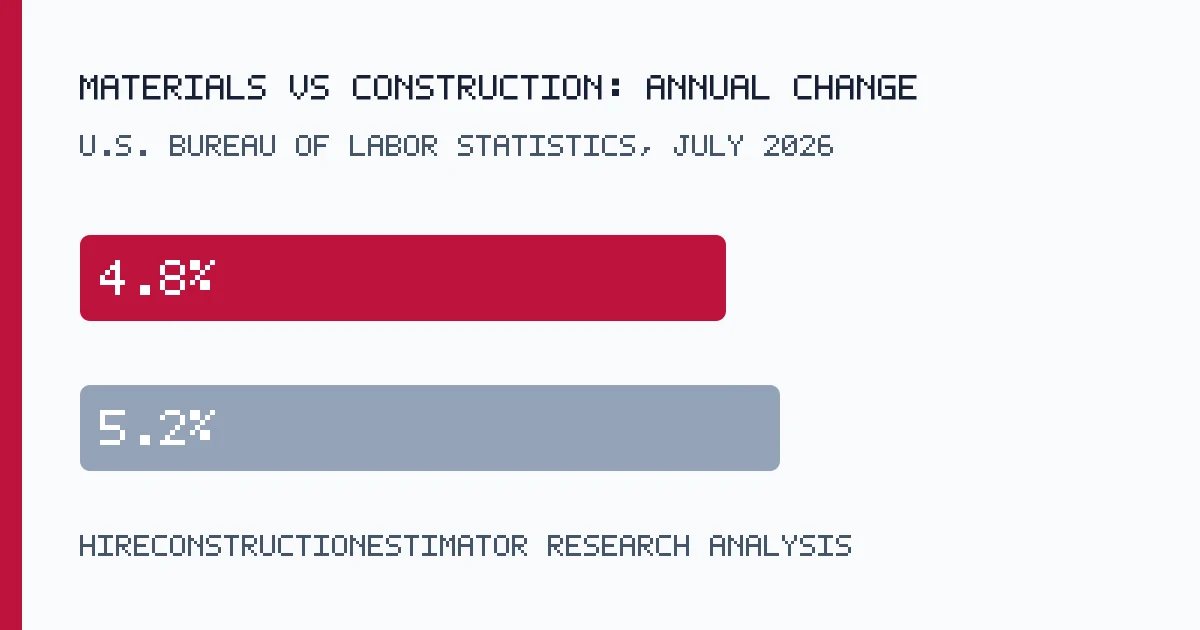
Materials and components for construction rose 0.5 percent in July and 4.8 percent over 12 months.

Verified August 28, 2026

Single-Family Permits Exceeded Starts by 86,000 Units in July 2026 data graphic

Residential Pipeline | 3 primary + 10 context references

Single-Family Permits Exceeded Starts by 86,000 Units in July 2026

Single-family permits ran at 894,000 units and starts at 808,000, an annualized gap of 86,000 units.

Verified August 27, 2026

Multifamily Permits Exceeded Starts by 69,000 Units in July 2026 data graphic

Residential Pipeline | 3 primary + 10 context references

Multifamily Permits Exceeded Starts by 69,000 Units in July 2026

Large-multifamily permits ran at 490,000 units while starts ran at 421,000.

Verified August 27, 2026

Housing Starts Ran 27,000 Units Above Completions in July 2026 data graphic

Residential Production | 3 primary + 10 context references

Housing Starts Ran 27,000 Units Above Completions in July 2026

Starts were 1.239 million units and completions were 1.212 million, a 27,000-unit annualized difference.

Verified August 27, 2026

Single-Family Homes Accounted for Most July 2026 Completions data graphic

Residential Production | 3 primary + 10 context references

Single-Family Homes Accounted for Most July 2026 Completions

Single-family completions ran at 878,000 units, compared with 329,000 in buildings with five units or more.

Verified August 27, 2026

Research Clusters

Labor Benchmarks: 37Pricing and Materials: 126Residential Production: 8Residential Pipeline: 8Cross Market Comparisons: 56Productivity and Risk: 10Safety and Risk: 1Spending Signals: 21Economic Context: 2Project Cost Signals: 10

Need a Sourced Estimate Review?

Talk with a pre-vetted estimating specialist about assumptions, quantity backup, and bid inputs.

Book a Call